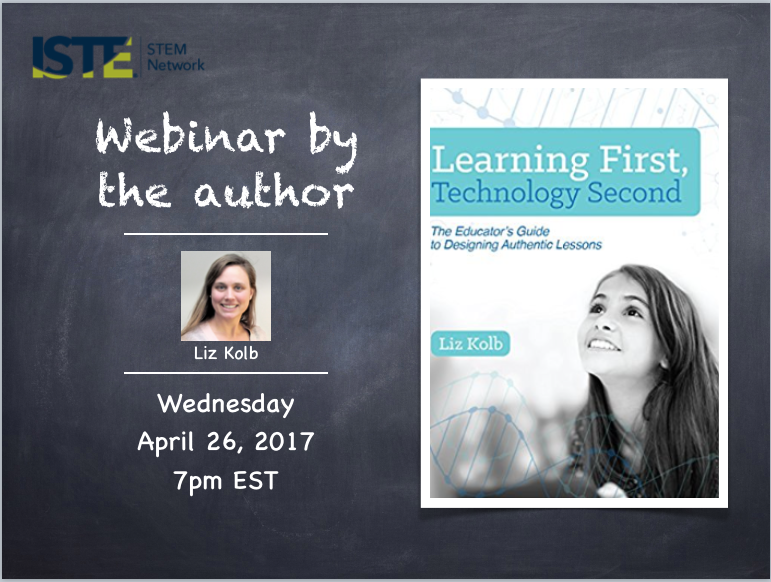
Click here to watch the ISTE STEM Webinar on Learning First, Technology Second. Liz Kolb shares how research informed the development of the Triple E Framework and how we can put learning first and make sure that technology is enhancing the learning.
0 Comments
5th grade teacher, Sarah Godek, decided that she wanted to simulate the revolutionary time period through discussion. She chose to use Twiducate, a tool that is a kid-friendly microblogging tool like Twitter. This lesson is situated within the larger context of a unit on the events leading up to and the play out of the American Revolutionary War, with a focus on the various different perspectives of people living in and around the British colonies. In Twiducate, students each took on a different perspective during the American revolution, so that they would better understand why some colonists decided to become loyalists, patriots or indifferent to the revolutionary cause. Prior to this lesson, students have learned about the unfavorable acts passed by the British Parliament, retaliatory events such as the Boston Massacre and the Boston Tea Party, and about the factions of colonists that developed as a result (loyalists and patriots). Following this lesson, students will study how the American Revolution began, progressed, and ended. This lesson is intended to allow students to see the greater arc of the American Revolution in the context of the various perspectives that it affected, and how not every perspective experienced the arc of the Revolution in the same “patriotic” way. Below Sarah describes how technology helped to engage, enhance and extend her learning goals.
This simulation is a great reminder that "older" technology can be extremely effective for learning when structured and used to leverage the learning goals. Just because a school doesn't have the latest technology, doesn't mean that students can't use the technology they do have to develop problem solving and critical thinking skills. This guest post was written by Noah Weber, a critical thinking teacher at Washtenaw Technical Middle College in Michigan. He shares about a simulation he developed using Google Sheets and the equations editor.
The Sustainable Societies Simulation is a semester-long Social Science experience in which students develop and lead their own society through a fictional world they share with their classmates. As students learn about different aspects of social science throughout the course, they use their newfound understanding to make important decisions about their simulated societies. For example, after learning about systems of government, students must choose the system of government they wish to adopt in their own society. These choices affect various indicators, which differentiate them from their neighbors. Adopting a presidential republic may boost their “Freedom” indicator, but it is also likely to hinder their “Security” score. A military junta, on the other hand, will likely enjoy loads of Security, but at a dire cost to the Freedom of the people. As students go on to make decisions and respond to scenarios, their various indicator values are tracked in a shared Google spreadsheet. Each student has a tab for their own society, and there is also a “Global Rankings” tab that shows the overall values for each indicator in every society in the simulation. This spreadsheet is the primary means through which students experience the benefits of the Triple-E framework… Engagement Does the technology allow students to focus on the assignment or activity with less distraction? The spreadsheet narrows the students’ focus to the specific indicators they are concerned with at any given time. While conversations in class may be far-reaching, and students may lose sight of the curricular objectives at any given time, the spreadsheet ensures that students come back to one simple question: how will this action change what I see on the spreadsheet? Does the technology motivate students to start the learning process? As the simulation goes on, students become very motivated to influence the values that are represented on the spreadsheet. The “Global Rankings” page helps students measure their societies against their classmates in different categories. The desire to become the class leader in any given indicator inspires students to develop proposals that will boost those values. Very few development proposals are assigned by the teacher; students tend to submit them on their own. Does the technology cause a shift in the behavior of the students, where they move from passive to active learners? As the leaders of their societies, students must take action to ensure their societies turn out the way they want them to. There are no “default” choices. Every choice matters, and students understand the consequences of those choices through how they affect the data in the spreadsheet. Even students who may be resistant to the activity are quick to realize that their society’s indicators are a reflection of their leadership. This inspires students to want to create the best society they can, and to make sure their success is reflected in the spreadsheet for all to see. Enhancement Does the technology tool aid students in developing a more sophisticated understanding of the content? The spreadsheet presents information that quantifies what are often somewhat abstract social science concepts. It can be hard to articulate the effective difference between different systems of government, for example, but the spreadsheet helps students see how those different systems may lead to different outcomes (as indicated by the point values). All of the choices they make are quantified in this fashion, and as the simulation goes on the students can observe through the spreadsheet how different their societies have become. This creates opportunities to reflect on the cause and effect of their decisions, and why certain societies may have indicators that are higher or lower than those of their classmates. Does the technology create scaffolds to make it easier to understand concepts or ideas? The spreadsheet boils many complex ideas down to basic indicators, but it also allows for more complex indicators to be added as the simulation goes along. Students can even recalculate existing data to create new composite indicators that are not already included. For some, the understanding may be as basic as “this system of government creates less freedom than that system,” but the spreadsheet leaves room for the understanding to go much deeper than that. Does the technology allow students to demonstrate their understanding of content that they could not do traditionally? One of the main ways that students interact with the simulation is through “Development Proposals.” These are descriptions of projects that students want to carry out to enact changes in their societies. In addition to describing the project, students must articulate how the project will affect the indicators on the spreadsheet. This forces them to think carefully about the consequences of their proposed actions, and to understand those consequences in terms of how they will reflect in the spreadsheet. Extension Does the technology create opportunities for students to learn outside of their typical school day? Students can access the spreadsheet at any time, and often do so outside of the normal class period and school day. Does the technology create a bridge between school learning and everyday life experiences? All of the choices and scenarios in the simulation are derived from real-world social science concepts. The indicators that are affected by their choices include ideas like freedom, security, and equality, which students can relate to as they consider what influences these values in their own lives. Does the technology allow students to build grit skills, that they can use in their everyday lives? The simulation requires problem-solving, as students figure out how to best manage their societies to balance the various indicators they see displayed. They must work together in this process, conducting trades and other types of diplomacy, which promotes the ability to collaborate with others. All of these interactions are managed directly through the spreadsheet using the comments feature. |
AuthorLiz Kolb is a clinical associate professor of education technologies at the University of Michigan in Ann Arbor. She works with over 150 preservice teachers every year on integrating technology into K-12 teaching. Categories
All
More Schools Using Triple E and Articles about #tripleE Kent ISD (MI)
Engaging the Rewired Brain Tech PD Blog Lafayette Jefferson High School (IN) #edtech Blog Noblesville Schools (IN) ISTE Ed Tek Hub West Bloomfield Schools (MI) From Texting to Teaching by Hyler and Hicks Van Buren Elementary School, Janesville (WI) About Education Article eSchoolNews Article Archives
October 2020
|